Monday 11 November 2019

Resale Flat Transactions Jumped 18 Per Cent in October 2019 - 99.co

Resale flat transaction volumes rose last month, following a relaxed income ceiling and higher grants. Prices are still mostly flat, however, and that’s unlikely to change anytime soon:

How many more flats were sold?

2,213 resale flats were sold in October, up from around 1,814 the month before. This is an increase of about 18 per cent month-on-month, and an increase of 10.6 per cent from October 2018.
Most of the units sold were four-room flats, accounting for around 41 per cent of total transactions. Four-room and three-room flats each made up about a quarter of total sales, with the rest being executive, 3G, and two-room flexi-flats.

However, resale flat prices are still in the doldrums

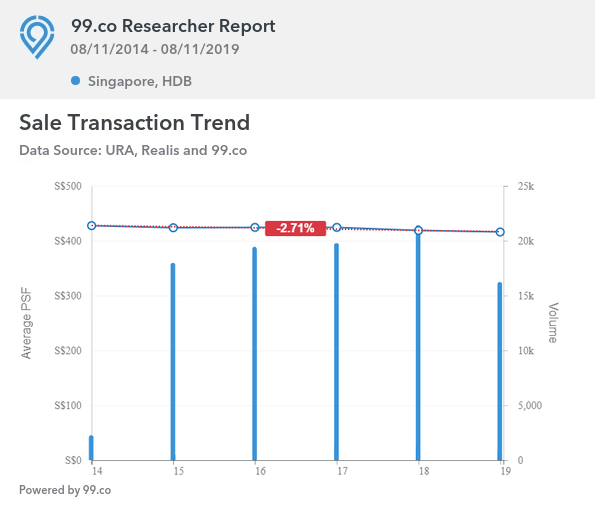
Resale flat prices dipped a further 0.2 per cent in October. The downward trend in resale flat prices has now lasted for about five years; across Singapore, resale flat prices are down about 2.7 per cent compared to 2014:
HDB resale prices 2014 - 2019
However, the decline in resale flat prices shows signs of slowing. According to The Business Times, younger flats (less than years old) saw a quarterly price decline of 2.5 per cent, as opposed to 4.8 per cent in the same time last year. Likewise, older flats (40 years and above) saw prices fall just 0.9 per cent in Q3 2019, from a much sharper 3.4 per cent dip in the same time last year.

Why is the volume of transactions rising?

One reason could be a recent tweak to HDB rules. Under the Enhanced Housing Grant (EHG), buyers can receive grants of up to $80,000 for both new and resale flats. Also, the income ceiling for HDB flats has been raised to $14,000, up from $12,000 previously.
Another reason is the large number of flats reaching their MOP this year. There’s increased availability of flats, including in desirable mature estates. Coupled with lower prices, this could prompt some buyers to consider resale instead of alternatives like BTO flats in less mature areas, or smaller condo units.

While sales volumes are likely to increase, prices are likely to stay flat


multi-ethnic singaporeans sitting
Good news for buyers: with a large number of flats reaching MOP, prices aren’t likely to rise anytime soon

From our perspective, resale flat prices have little room to rise in 2019, or even in 2020. This can be chalked up to two main factors:
The first is the large amount of supply, from the sheer number of units reaching their MOP. Some 50,000 flats are expected to reach MOP in 2020 to 2021. With so many upgraders hoping to sell and upgrade, buyers have the clear upper hand.
The second reason is the emotional: HDB flats have gradually been re-positioned, from surefire investments to just “a roof over your head”. The renewed emphasis – particularly with growing worries of lease decay – has provided Singaporeans with a reality check. While we still see the occasional million-dollar flat, the days of sky high Cash Over Valuation (COV) are mostly at an end, barring significant shifts in government policy.

Does that mean now is a good time to buy a resale flat?

Resale flats have been affordable for a long time now – buyers today are no longer subject to high COV, which was practically a norm in the property heydays of 2009 to 2013.
Some buyers, being aware of the supply situation, may be thinking of waiting even longer – till about 2020 or 2021 for reasons mentioned above. However, remember that by then the location you want may no longer be available; nor is there a guarantee that the specific neighbourhood you’re after may see significant price drops.
Home buyers should stay focused on affordability, rather than trying to time the market. For those who buy today, it could be argued you’re already getting a better deal, compared to many buyers from the previous decade.
Are you eager to buy a resale flat anytime soon? Voice your thoughts in our comments section or on our Facebook community page.
Looking for a property? Find the home of your dreams today on Singapore’s largest property portal 99.co! You can also access a wide range of tools to calculate your down payments and loan repayments, to make an informed purchase.
4 min read · 
Source: 99.co (11 Nov 2019)


Friday 8 November 2019

More HDB resale flats sold in Oct after policy changes kick in - SRX


BT 20191108 HDB
In all, 2,213 HDB resale flats changed hands, up 18 per cent from September, says real estate portal SRX Property. Compared with a year ago, the resale volume was 10.6 per cent higher. 

MORE Housing and Development Board (HDB) resale flats were sold last month compared with previous months after higher grants and income ceilings for first-time buyers took effect in September.
In all, 2,213 HDB resale flats changed hands, an 18 per cent increase from September, real estate portal SRX Property said on Thursday. Compared with a year ago, the resale volume was 10.6 per cent higher.
Four-room flats made up 40.8 per cent of the units sold last month. Five-room flats were 24.3 per cent; three-room flats 25.4 per cent; and executive flats 7.5 per cent. The rest were multi-generation and two-room flats.

Analysts say the policy changes last month could have had an impact on the resale market.
In September, the government announced a new Enhanced CPF Housing Grant (EHG) of up to S$80,000 available to eligible first-time flat buyers, regardless of whether they get a new or resale flat. There are also no restrictions on their choice of flat type and location.
ERA Realty head of research and consultancy Nicholas Mak said: "Home buyers are probably capitalising on the (EHG) grant, as transaction volume increased in October.
This figure is the highest since July last year, almost 21 per cent more than the 12-month average."
Christine Sun, head of research and consultancy at OrangeTee, said: "Demand for HDB resale flats has continued to strengthen after a number of new policies have been introduced progressively in recent months."
Resale flat prices in October dipped by 0.2 per cent over September's figures, although this was still 0.1 per cent higher than a year ago.
Compared with their peak in April 2013, October resale prices were 14.3 per cent lower. Prices in non-mature estates rose by 1.1 per cent year on year while those in mature estates fell 1.3 per cent.
The most expensive resale flat last month was a five-roomer at The Pinnacle@Duxton, which went for S$1.1 million. An executive maisonette unit in Hougang was sold at S$850,000, the highest price in a non-mature estate.
SRX calculations showed that resale flat buyers in October paid what it estimates to be the market value for flats, neither over- nor underpaying.
The data showed that the overall median transaction over X-value (TOX) was zero last month.
TOX measures how much a buyer is overpaying (positive value) or underpaying (negative value) for a property based on SRX's computer-generated market value. The data only includes districts with more than 10 resale transactions.
HDB executive and five-room flats recorded positive median TOX values of S$6,000 and S$2,000 last month, while three-room and four-room flats both recorded a negative median TOX value of S$1,000.
Flats in Serangoon recorded the highest median TOX at positive S$9,500, while those in Queenstown recorded the lowest median TOX, at negative S$12,000.
ERA's Mr Mak expects the resale volume in the next month to remain high, with home buyers continuing to make use of various government housing grants.
OrangeTee's Ms Sun said that prices should remain stable despite the increased demand: "More flats will be reaching their five-year minimum occupation period and HDB is likely to increase the supply of flats in 2020. The increasing supply of flats is likely to keep prices in check in the coming months."
SRX forecasts that in the next three months, 2,320 flats will be put on the resale market as they approach their five-year minimum occupation period.
Source: The Business Times


Source: SRX (08 Nov 2019)


Real Estate Experts Share How They Plan Their Property Purchases - 99.co


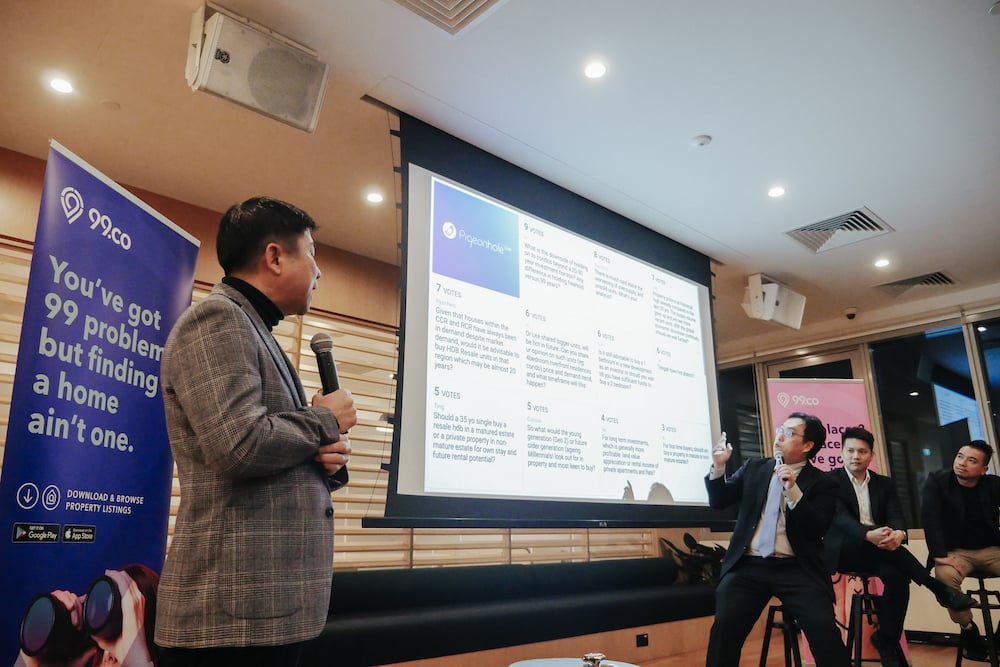
Dr Boaz moderating a Q&A session
Property enthusiasts of all ages gathered for the second edition of Haus it Going

Even if you are not a newbie to the property scene, the number of jargons and schemes to keep up with can be pretty overwhelming. It is why we rely on experts, and property sites like 99.co (woohoo!), to keep us in the loop.
For a round-up of what’s what in this year’s property scene, we consulted three experts. Dr Lee Nai Jia of Knight Frank Singapore shared his company’s property findings, Ryan Teow of OCBC Bank introduced the basics of property financing, and Quck Zhong Yi of Asolidplan shared innovative ways to turn properties into homes. The panel attended the second edition of Haus it Going, a 99.co property seminar and flagship event.


Here is what we’ve learnt about property investing.

Locations that should be on your watchlist

Dr Lee  highlighted that significant interest was shown to several districts over the course of 2018 and 2019. They are:
  • District 19 – Hougang, Sengkang, Punggol
  • District 18 – Tampines, Pasir Ris
  • District 5 – Clementi, Pasir Panjang, West Coast, Dover, Buona Vista
  • District 3 – Alexandra, Commonwealth
We have new launches and more to thank for these. They include the Piermont Grand condominium and Punggol Digital District (PDD) in District 19, the Treasure at Tampines project — which has over 2,000 units — in District 18, and the Parc Clematis project in District 5. Built-to-Order (BTO) launches will also affect the number of activities in certain areas.


Full house at Haus it Going by 99.co
A full-house event at WeWork Funan

Singapore property and how it’s affected by the trade war

Singapore’s real estate scene might just benefit from the trade war. Often seen as a safe haven for property, many foreign investors are flocking to our little red dot.
“As we are still unsure of [the trade war’s] conclusion, it is best [for investors] to look at safe assets like gold and bonds. While real estate hasn’t picked up, it is stable,” says Dr Lee.
But where are these foreign investors from exactly? According to research by Knight Frank, common countries include India, Indonesia, and Malaysia. There is a sliver of “unspecified foreign buyers”*, too. Anecdotal evidence suggests most foreign buyers are from China.
Regardless of nationality, it seems that foreign buyers are mostly interested in District 9 and 10 properties. The Knight Frank research reports that in the first to third quarter of 2019, 121 units in District 10 were purchased by foreign buyers. One reason for this, according to Dr Lee, is that most foreign buyers are not as knowledgeable about other local neighbourhoods.
*To form quarterly property market reports, the Urban Redevelopment Authority extracts information from two places: caveats lodged and developers’ survey. While caveats are informative, surveys do not state the ethnicities or nationalities of interested investors.


Want to add value? Spruce up your home 

Interior design adds value to a home, especially older properties. “When you buy an older flat for returns, you need to add value to the apartment. You can do that through interior design. When the interior design is good, people tend to overpay,” says Dr Lee. Some things you can do to improve your home design, according to architect Quck Zhong Yi, include:
    • Maximising the view you have. It can make a great first impression for guests and potential buyers in the future.
    • Creating dialogue between spaces: “For one of our homes, we created a seamless and open space from living room to kitchen. There are pockets of windows between the spaces so homeowners remain connected, too,” says Zhong Yi.
    • Ensuring enough storage: On the other hand, having lots of built-in storage can help you reduce clutter around the house. Take stock of what you have and allocate a space for it. Lining your storage across a wall, or replacing walls with storage, achieves a cleaner look.

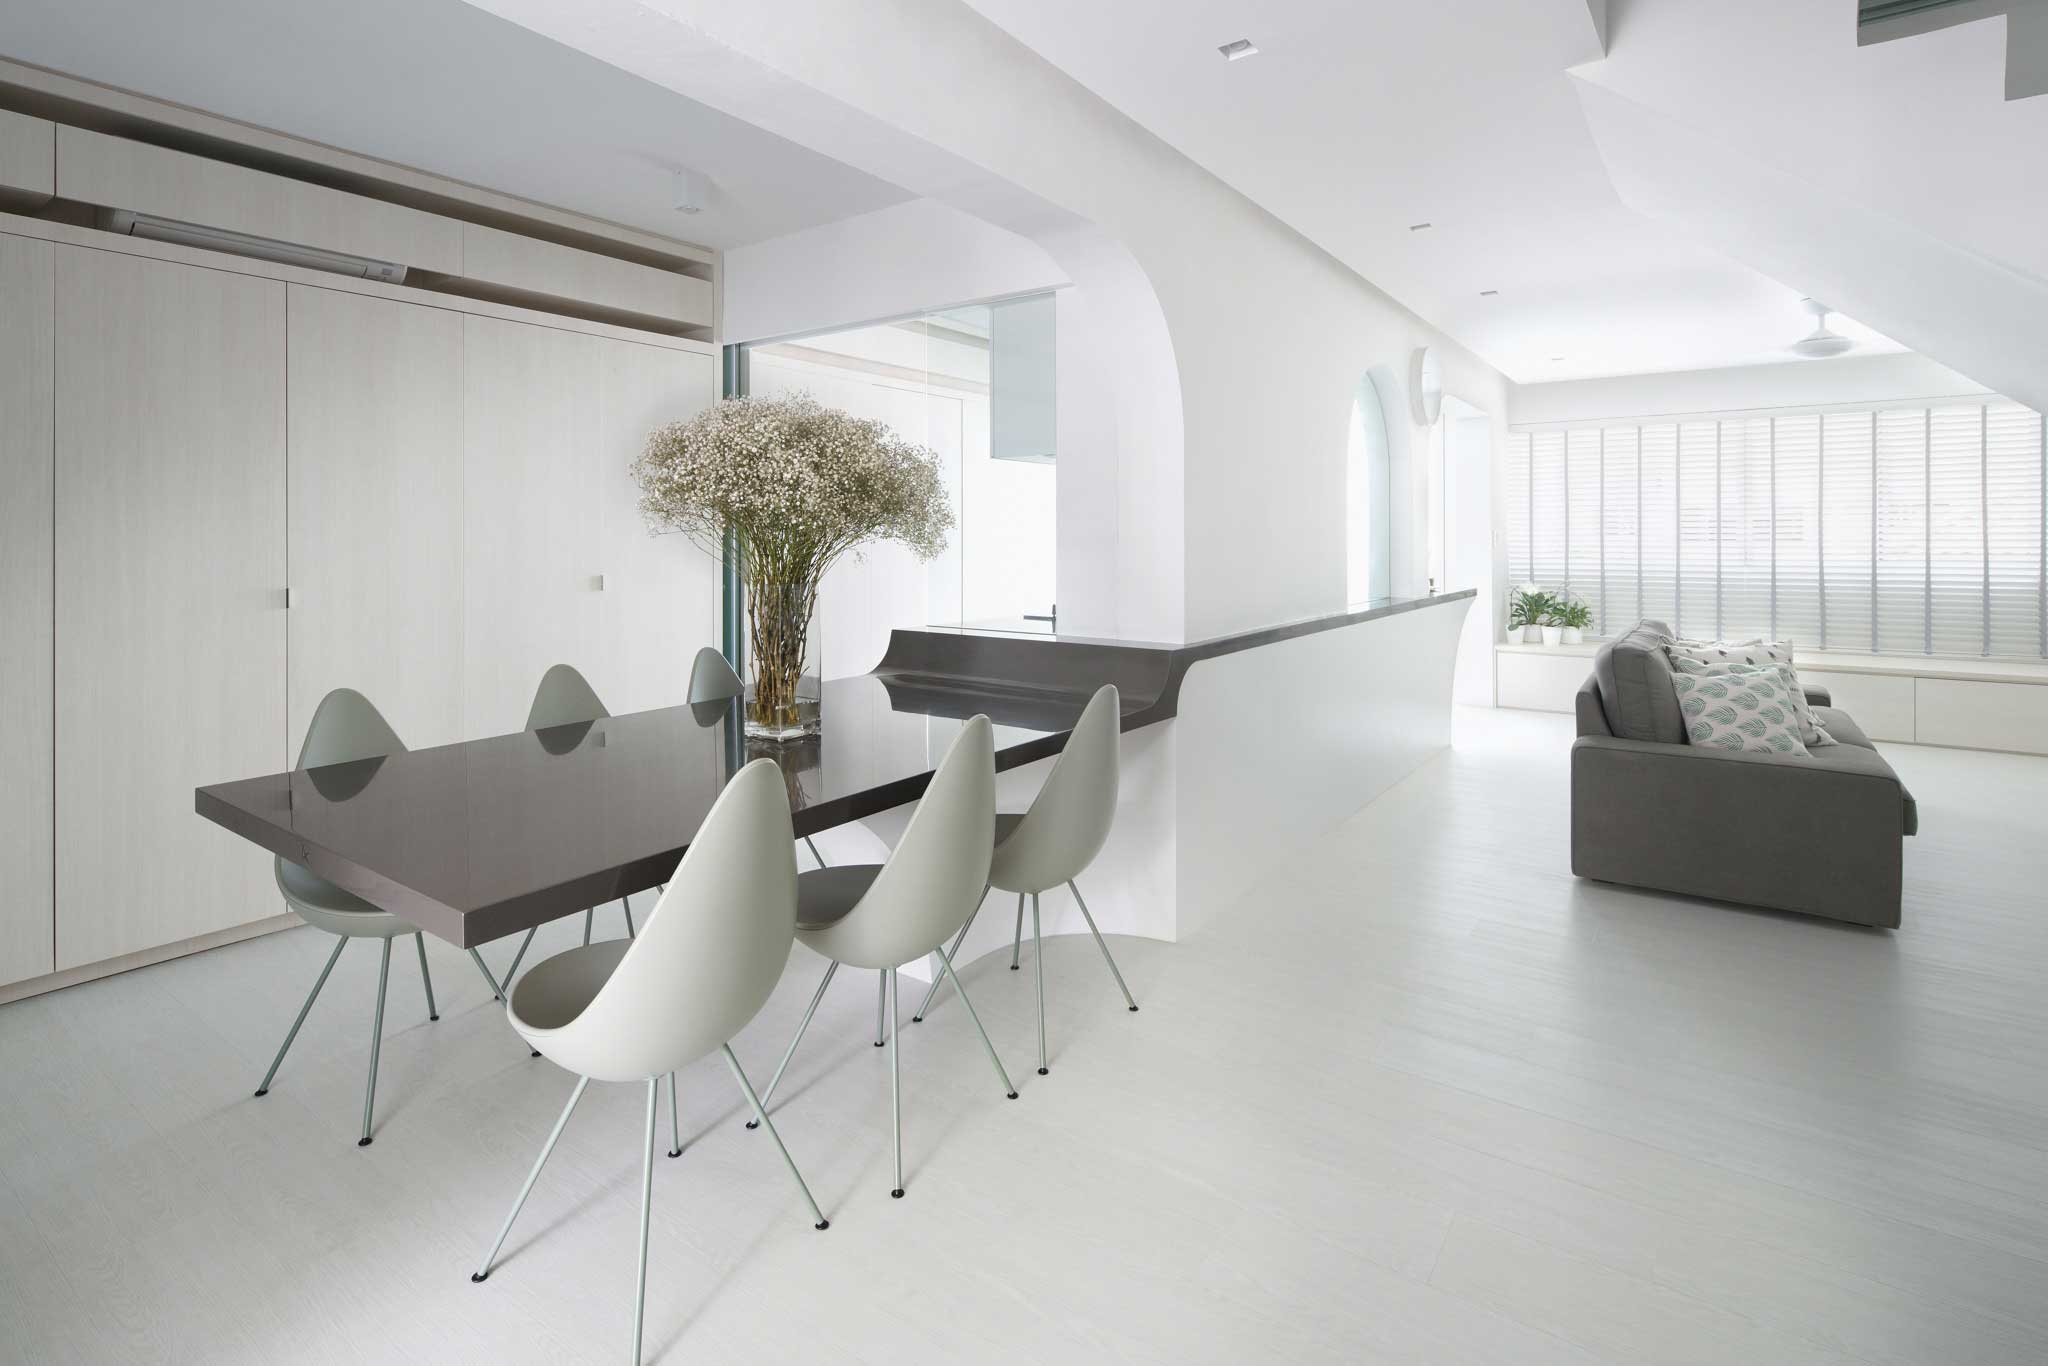
An interior design project by Asolidplan
A fresh take on a HDB maisonette by Asolidplan

Are old properties really that jialat

People rarely see old properties as a money-making asset. But is it all that bad? Dr Lee offered a different perspective — especially for those planning to keep a condominium beyond a 20-30 year investment horizon.
He says, “Some say that if you want to hold to a condominium that long, you might as well get a freehold; this is because prices have been proven to drop exponentially after the 60-year point. However, freehold prices might drop, too, as there is the matter of physical obsolescence. When you keep a condominium for that long, you are seeking one thing and one thing only: en-bloc.”
En-bloc is truly the best case scenario, as finding a buyer for old flats might prove to be tricky.
“Do take note that banks consider the remaining lease of a property [before deciding on a loan amount]. If you were to buy a 50-year remaining lease property and you want to sell it 10 years later (at a 40-year remaining lease), the loan amount that your prospective buyer will receive is reduced. This will greatly reduce the prospect [of you selling the house], unless your buyers are paying by cash,” explains Ryan.

Know how much your property will actually cost you

Your dream condo unit might cost $700,000, but that’s not all you will be paying. Before calculating how much you should be saving or earning per month to afford it, take note of these “hidden” fees that will affect the total amount you will be paying.
Buyer Stamp Duty: This applies to all property purchases. The more expensive the property, the more you will pay. Read about buyer stamp duty rates here.
Additional Buyer Stamp Duty (ABSD): Applicable if you are buying your second or third property. Good news is, you might be eligible for a remission
Legal fees: Hey, someone needs to sort out the paperwork and legal checks for you. 
Valuation fees: To know how much a property is worth, it has to undergo a valuation.
Mortgage Rates: There are three types of mortgage rates, each differentiated by who determines them. They are SIBOR and Fixed Rate — we talked about them here — as well as Board Rate, which means the bank determines your interest rate based on internal requirements.
Sales Agent Fee: Common commission rates for HDBs are 1% from buyer and 2% from seller, whereas it is 2% for sellers of private properties.
Property Tax: This is based on a tax rate on the Net Annual Value of your property.
Maintenance fees: These are the Monthly Service & Conservancy Charges for HDBs and services fees for private condominiums. More on how these are priced here.
Will the total cost of your property purchase impede your decision to buy a private property?

When investing, consider these important questions

Dr Lee advises that when hunting for properties with investment potential, consider not only prices but mega trends as well. Answer these questions:
    • When your kids grow up, what type of homes would they [and their age group] want to live in? Due to globalisation and more people travelling for work, Dr Lee suggests that the future might be in renting rather than owning a property. Future property owners will also look out for greener and more sustainable spaces, due to the global awareness on climate change.
    • When you are old, what kind of area would you like to live or retire in? Consider car-lite areas like Tengah, as you are less likely to drive or have a car the older you get; Places with more leisure areas like Waterway at Punggol are ideal for family activities; and Tanglin, where you do not have to travel far for hospitals, food, and shopping.
    • “Base your investing steps on these two scenarios, and you won’t fail,” he says.
Have a topic you want covered? Share it here and we’ll try and cover it at the next Haus it Going event!
This event was sponsored by Affinity at Serangoon and Riverfront Residences — both Oxley Holdings’ properties. Read more about our panel of speakers, as well as moderator, on the Haus it Going site.

7 min read · 


Thursday 7 November 2019

HDB Median resale prices for registered resale applications The median resale prices by town and flat type for resale cases registered in the 3rd Quarter of 2019 - HDB

The median price is the fiftieth percentile amount of HDB resale flat purchases. This means that half of the flats transacted were purchased at amounts above the median price, and half of the flats were purchased at amounts below the median price. These figures are based on resale flat transactions recorded for the quarter, and sorted by town and flat type.


Legend

Here are the notes and legends for the symbols used in the following table:
  • (-) indicates no resale transactions in the quarter
  • Asterisks (" * ") refer to cases where there are less than 20 resale transactions in the quarter for the particular town and flat type. The median prices of these cases are not shown as they may not be representative
  • The data excluded transactions that may not accurately reflect the market price, i.e. resale of part shares, resale between related parties, cases under the Conversion Scheme, resale of terrace flats, and converted flats
  • The figures are rounded to the nearest hundred dollars
The following table shows the median resale prices by town and flat type for resale cases registered in the 3rd quarter of 2019:

Source: HDB

For Full Resale Statics


Release of 3rd Quarter 2019 real estate statistics - URA

Published: 25 October 2019
The Urban Redevelopment Authority (URA) released today the real estate statistics for 3rd Quarter 20191.
PRIVATE RESIDENTIAL PROPERTIES
Private residential market at a glance:

* Figures exclude Executive Condominium (ECs)
Prices and Rentals
Prices of private residential properties increased by 1.3% in 3rd Quarter 2019, compared with the 1.5% increase in the previous quarter.
Property Price Index of private residential properties


Prices of landed properties increased by 1.0% in 3rd Quarter 2019, compared with the 0.1% decrease in the previous quarter. Prices of non-landed properties increased by 1.3% in 3rd Quarter 2019, compared with the 2.0% increase in the previous quarter.
Prices of non-landed properties in Core Central Region (CCR) increased by 2.0% in 3rd Quarter 2019, compared with the 2.3% increase in the previous quarter. Prices of non-landed properties in Rest of Central Region (RCR) increased by 1.3%, compared with the 3.5% increase in the previous quarter.  Prices of non-landed properties in Outside Central Region (OCR) increased by 0.8%, compared with the 0.4% increase in the previous quarter (see Annexes A-1A-2 & A-62).
Rentals of private residential properties increased by 0.1% in 3rd Quarter 2019, compared with the 1.3% increase in the previous quarter.
Rental Index of private residential properties
Rentals of landed properties decreased by 2.3% in 3rd Quarter 2019, compared with the 0.3% increase in the previous quarter. Rentals of non-landed properties increased by 0.4%, compared with the 1.4% increase in the previous quarter.
Rentals of non-landed properties in CCR decreased by 0.7%, compared with the 1.5% increase in the previous quarter. Rentals in RCR increased by 1.6%, compared with the 1.4% increase in the previous quarter.  Rentals in OCR increased by 0.8%, compared with the 1.2% increase in the previous quarter (see Annexes A-3 & A-4).
Launches and Take-up
Developers launched 3,628 uncompleted private residential units (excluding ECs) for sale in 3rd Quarter 2019, compared with 2,502 units in the previous quarter (see Annex C-1).
Developers sold 3,281 private residential units (excluding ECs) in 3rd Quarter 2019, compared with the 2,350 units sold in the previous quarter.  (see Annex D).
Number of private housing units launched and sold by developers (excluding ECs)
Developers launched 820 EC units for sale in 3rd Quarter 2019. 426 EC units were sold in the quarter (see Annex F). In comparison, developers did not launch any EC units and sold 10 EC units in the previous quarter.
Resales and Sub-sales
There were 2,378 resale transactions in 3rd Quarter 2019, compared with the 2,371 units transacted in the previous quarter. Resale transactions accounted for 41.3% of all sale transactions in 3rd Quarter 2019, compared with 49.7% in the previous quarter (see Annex D).
There were 104 sub-sale transactions in 3rd Quarter 2019, compared with the 45 units transacted in the previous quarter. Sub-sales accounted for 1.8% of all sale transactions in 3rd Quarter 2019, compared with 0.9% in the previous quarter (see Annex D).
Number of resale and sub-sale transactions for private residential units (excluding ECs)
Supply in the Pipeline
As at the end of 3rd Quarter 2019, there was a total supply of 50,964 uncompleted private residential units (excluding ECs) in the pipeline with planning approvals3, compared with the 50,674 units in the previous quarter (see Annexes E-1 & E-24). Of this number, 31,948 units remained unsold as at the end of 3rd Quarter 2019, compared with the 33,673 units in the previous quarter (see Annexes B-1 & B-2).
After adding the supply of 3,722 EC units in the pipeline, there were 54,686 units in the pipeline with planning approvals (see Annex E-3). Of the EC units in the pipeline, 2,141 units remained unsold. In total, 34,089 units with planning approvals (including ECs) remained unsold, down from 35,538 units in the previous quarter.
Total number of unsold private residential units in the pipeline
Based on the expected completion dates reported by developers, 3,235 units (including ECs) will be completed in the last quarter of 2019.  Another 5,750 units (including ECs) will be completed in 2020.
Pipeline supply of private residential units and ECs (with planning approvals) by expected year of completion

Note: 5,229 private residential units and 855 executive condominiums were completed (i.e. obtained TOP) in 1Q-3Q2019.
Apart from the 34,089 unsold units (including ECs) with planning approval as at the end of 3rd Quarter 2019, there is a potential supply of 4,900 units (including ECs) from Government Land Sales (GLS) sites and awarded en-bloc sale sites that have not been granted planning approval yet. These comprise (a) about 4,400 units from awarded GLS sites and Confirmed List sites that have not been awarded yet, and (b) about 500 units from transacted en-bloc sale sites5.
Stock and Vacancy
The stock of completed private residential units (excluding ECs) increased by 278 units in 3rd Quarter 2019, compared with the increase of 863 units in the previous quarter. The stock of occupied private residential units (excluding ECs) increased by 1,095 units in 3rd Quarter 2019, compared with the increase of 584 units in the previous quarter. As a result, the vacancy rate of completed private residential units (excluding ECs) decreased to 6.1% as at the end of 3rd Quarter 2019, from 6.4% in the previous quarter (see Annex E-1).
Stock and vacancy of private residential units (excluding ECs)
Vacancy rates of completed private residential properties as at the end of 3rd Quarter 2019 in CCR, RCR and OCR were 8.2%, 6.0% and 5.3% respectively, compared with the 7.8%, 6.4% and 5.7% in the previous quarter (see Annex E-4).
OFFICE SPACE
Office market at a glance:
Prices and Rentals
Prices of office space decreased by 3.9% in 3rd Quarter 2019, compared with the 0.9% increase in the previous quarter (see Annex A-1). Rentals of office space decreased by 0.6% in 3rd Quarter 2019, compared with the 1.3% increase in the previous quarter (see Annexes A-3 & A-5).
Property Price Index of office space in Central Region
Rental Index of office space in Central Region
Supply in the Pipeline
As at the end of 3rd Quarter 2019, there was a total supply of about 738,000 sq m GFA of office space in the pipeline, compared with the 732,000 sq m GFA of office space in the pipeline in the previous quarter (see Annexes E-1 & E-2).
Pipeline supply of office space
Note: 57,333 sq m of office space was completed (i.e. granted TOP) in 1Q-3Q2019
Stock and Vacancy
The amount of occupied office space increased by 71,000 sq m (nett) in 3rd Quarter 2019, compared with the increase of 35,000 sq m (nett) in the previous quarter. The stock of office space decreased by 4,000 sq m (nett) in 3rd Quarter 2019, compared with the increase of 7,000 sq m (nett) in the previous quarter. As a result, the island-wide vacancy rate of office space declined to 10.6% as at the end of 3rd Quarter 2019, from 11.5% as at the end of the previous quarter (see Annexes A-5 & E-1).
Stock and vacancy of office space
RETAIL SPACE
Retail market at a glance:
Prices and Rentals
Prices of retail space increased by 1.1% in 3rd Quarter 2019, compared with the increase of 0.4% in the previous quarter (see Annex A-1). Rentals of retail space increased by 2.3% in 3rd Quarter 2019, compared with the decrease of 1.5% in the previous quarter (see Annexes A-3 & A-5).
Property Price Index of retail space in Central Region
Rental Index of retail space in Central Region
Supply in the Pipeline
As at the end of 3rd Quarter 2019, there was a total supply of 288,000 sq m GFA of retail space from projects in the pipeline, compared with the 320,000 sq m GFA of retail space in the pipeline in the previous quarter (see Annexes E-1 & E-2).
Pipeline supply of retail space

Note: 143,139 sq m of retail space was completed (i.e. granted TOP) in 1Q-3Q2019.
Stock and Vacancy
The amount of occupied retail space increased by 29,000 sq m (nett) in 3rd Quarter 2019, compared with the increase of 74,000 sq m (nett) in the previous quarter. The stock of retail space increased by 16,000 sq m (nett) in 3rd Quarter 2019, compared with the increase of 18,000 sq m (nett) in the previous quarter. As a result, the island-wide vacancy rate of retail space decreased to 7.5% as at the end of 3rd Quarter 2019, from 7.7% as at the end of the previous quarter (see Annexes A-5 & E-1).
Stock and vacancy of retail space

URA’S REAL ESTATE INFORMATION SERVICE
More detailed information on the price and rental indices, supply in the pipeline, stock and vacancy rates of the various property sectors can be found in the Real Estate Information System (REALIS), an online database of URA.
More information on REALIS can be found at https://spring.ura.gov.sg/lad/ore/login/index.cfm.
1Statistics in this press release are based on quarter to quarter comparisons, unless otherwise stated.
2The prices of private residential properties are not uniform and vary from project to project. Home-buyers can view more detailed information on transactions of private residential properties at:  https://www.ura.gov.sg/realEstateIIWeb/transaction/search.action. Similar information can also be accessed by users on the go via URA’s iphone/ipad application. The application can be downloaded directly from https://itunes.apple.com/app/property-market-information/id573494340?mt=8.
3
Projects in the pipeline are new development or redevelopment projects with planning approvals, i.e. Provisional Permission (PP) or Written Permission (WP).
4More detailed data on supply in the pipeline by market segment, development status and expected year of completion can be found at https://www.ura.gov.sg/realEstateIIWeb/supply/search.action.
5The en-bloc sales of existing developments are subject to regulatory conditions, such as the issuance of the collective sale order by the Strata Titles Board under the Land Titles (Strata) Act. New private housing supply from these sites is estimated based on their site areas and allowable plot ratios under Master Plan 2014. For each site, the number of units proposed by the developer will be subject to detailed evaluation to determine if it can be supported. En-bloc sale sites sold up to mid-September have been included.

Summary of Key Information for 3rd Quarter 2019
AnnexTitle
Annex A-1 [PDF, 15kb]Comparison of Property Price Index for 2nd Quarter 2019 and 3rd Quarter 2019
Annex A-2 [PDF, 18kb]Price Indices of Non-Landed Properties by Market Segment
Annex A-3 [PDF, 15kb]Comparison of Rental Index for 2nd Quarter 2019 and 3rd Quarter 2019
Annex A-4 [PDF, 19kb]Rental Indices of Non-Landed Properties by Market Segment
Annex A-5 [PDF,138kb]Median Rentals and Vacancy of Office and Retail Space
Annex A-6 [PDF, 20kb]Chart of Property Price Index by Type of Property
Annex A-7 [PDF,16kb]Chart of Residential Property Price Index by Type
Annex B-1 [PDF, 13kb]Number of Unsold Private Residential Units from Projects with Planning Approvals
Annex B-2 [PDF, 18kb]Number of Unsold Private Residential Units from Projects with Planning Approvals by Market Segment
Annex C-1 [PDF, 20kb]Number of Uncompleted Private Residential Units Launched in the Quarter by Market Segment
Annex C-2 [PDF, 124kb]Number of Private Residential Units Sold in the Quarter by Market Segment
Annex D [PDF,150kb]Number of New Sale, Sub-Sale and Resale Transactions for Private Residential Units by Market Segment
Annex E-1 [PDF, 123kb]Stock & Vacancy and Supply in the Pipeline as at End of 3rd Quarter 2019
Annex E-2 [PDF, 128kb]Supply in the Pipeline by Development Status and Expected Year of Completion as at End of 3rd Quarter 2019
Annex E-3 [PDF, 80kb]Pipeline Supply of Private Residential Units and Executive Condominiums by Expected Year of Completion as at End of 3rd Quarter 2019
Annex E-4 [PDF, 17kb]Vacancy of Private Residential Units by Market Segment
Annex F [PDF, 134kb]Number of Executive Condominium Units Launched and Sold in the Quarter


Source: URA